Ever bought a token right when the charts looked perfect, only to watch the price reverse minutes later?
It happens often in crypto markets. The problem is that price charts mainly show what has already happened. To better understand where the market may be heading, many traders and researchers look beyond technical analysis and start tracking on-chain activity instead.
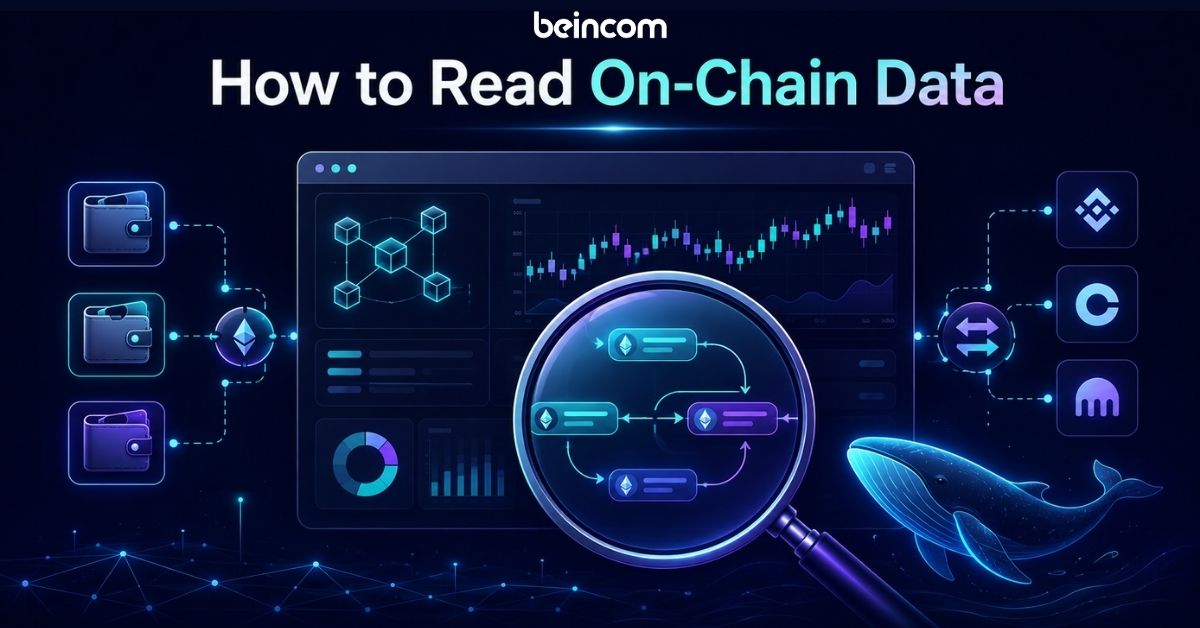
Because blockchains are public, anyone can view wallet movements, token transfers, exchange flows, and smart contract interactions in real time. Learning how to read this data can help users spot whale activity, monitor market behavior, and identify trends that may not be obvious from price action alone.
What Is On-Chain Data and Why Does It Matter?
On-chain data refers to any activity recorded directly on a blockchain network such as Bitcoin, Ethereum, or Solana. This includes wallet balances, token transfers, transaction history, NFT activity, and smart contract interactions.
Unlike traditional finance, where most transaction data is private, blockchain activity is publicly accessible. Anyone can inspect wallet movements and verify transactions using blockchain explorers and analytics platforms.
This transparency is one of the biggest advantages of crypto markets. Instead of relying only on charts, news, or social sentiment, users can analyze what is actually happening on-chain in real time.
For example:
- Large transfers to exchanges may indicate potential selling pressure
- Rising wallet activity can signal growing adoption
- Increasing stablecoin flows may suggest capital entering the market
On-chain analysis is commonly used by traders, researchers, DeFi users, and NFT participants to better understand market behavior and evaluate projects more effectively.
The 3-Step Workflow for Reading On-Chain Data
Reading blockchain activity can feel overwhelming at first because there is so much public data available. Instead of trying to track everything at once, it is easier to follow a simple workflow.
Start by learning how to read transactions on blockchain explorers, then move on to broader market signals like exchange flows and whale activity. Over time, these patterns become much easier to recognize.
Step 1: Learn to Use Blockchain Explorers
Blockchain explorers are the easiest way to start reading on-chain activity. These tools allow users to search wallet addresses, token transfers, NFT activity, and smart contract interactions directly on the blockchain.
Popular Blockchain Explorers
| Blockchain | Explorer |
|---|---|
| Ethereum | Etherscan |
| BNB Chain | BscScan |
| Polygon | PolygonScan |
| Solana | Solscan, SolanaFM |
| Bitcoin | Blockchain.com, Blockchair |
Most explorers are free and work like public search engines for blockchain activity.
What to Look for in a Transaction
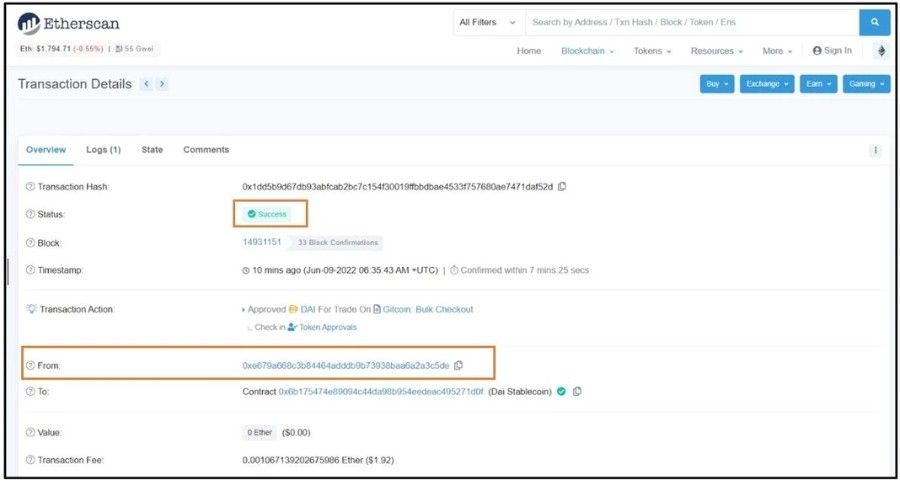
When viewing a transaction on Etherscan or similar explorers, several fields are especially important.
- From / To: shows the sender and receiver wallets
- Value: shows how much cryptocurrency was transferred
- Method: identifies the type of action, such as a transfer, swap, or mint
- Gas Fees: shows the transaction cost paid to the network
- Status: indicates whether the transaction succeeded, failed, or is still pending
Large transfers between whale wallets and exchanges are usually monitored closely because they may signal increased buying or selling activity.
Common Patterns to Watch
Reading individual transactions is useful, but patterns across multiple transactions often provide more meaningful insight.
Some common examples include:
- Repeated large transfers to exchanges
- Whale wallets are accumulating tokens over time
- Spikes in DEX trading activity
- Newly funded wallets are suddenly becoming active
- Large stablecoin inflows during volatile market conditions
For example, multiple large transfers into Binance may suggest potential selling pressure, while consistent withdrawals from exchanges are often interpreted as accumulation.
Step 2: Watch Key On-Chain Signals
Once you know how to read an individual transaction, zoom out. Look at the aggregate health of the network using these core metrics:
- Active Addresses: The number of unique wallets interacting with the blockchain daily. Steady growth here is a highly bullish indicator of true utility.
- Exchange Flows (Inflows vs. Outflows):
- High Inflows: More coins are moving onto exchanges. This usually implies potential selling pressure (Bearish).
- High Outflows: More coins are moving off exchanges into private wallets. This implies long-term holding/accumulation (Bullish).
- Whale Movements: Massive transactions (typically over $1M). You can easily track these in real-time via automated services like Whale Alert.
- SOPR & MVRV (Realized Profit/Loss): Advanced valuation metrics. When the MVRV ratio is exceptionally high, it means most holders are sitting on massive unrealized profits—a classic sign that the market might be topping out as people look to take profit.
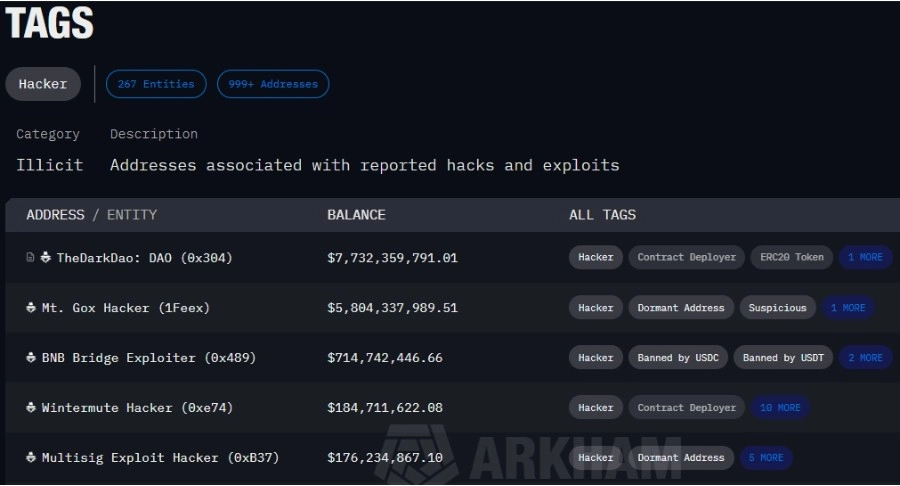
Tools like Arkham Intelligence help label wallets and track whale activity, while platforms such as Glassnode and CryptoQuant focus more on exchange flows, network activity, and broader market trends. Dune Analytics is also widely used for custom dashboards and DeFi analytics, especially within the Ethereum ecosystem.
Step 3: Build a Simple On-Chain Workflow
A simple workflow can make on-chain analysis much easier for beginners.
1. Start With the Token or Project
Check the token page on CoinMarketCap or a blockchain explorer. Review transaction activity, holders, and liquidity data.
For example, go to the token’s explorer page and click on the “Holders” tab. If the top 10 wallets control 80% to 90% of the circulating supply (excluding exchange addresses or locked team vesting smart contracts), the risk of getting dumped on is incredibly high. Look for tokens with a healthier, more distributed supply.
2. Track Large Wallets
Look for whale wallets, exchange wallets, treasury wallets, or smart money addresses interacting with the token.
3. Set Alerts
Tools like Arkham Intelligence and Whale Alert allow users to monitor major wallet movements in real time.
For instance, if the team or a major seed investor suddenly starts moving millions of tokens toward Binance or OKX, it’s time to play defense.
4. Combine On-Chain Data With Other Signals
On-chain analysis works best when combined with:
- Price action
- Market sentiment
- News events
- Macro conditions
For example, rising active addresses combined with whale accumulation and positive ecosystem news may provide a stronger signal than price action alone.
Common Limitations of On-Chain Analysis
While on-chain analysis is useful, it does not always reveal intent perfectly.
For example, large transfers to exchanges may indicate potential selling pressure, but they can also represent internal wallet transfers, treasury management, or collateral deposits.
Blockchain wallets are also pseudonymous rather than fully identifiable. Although analytics platforms label many addresses, some large holders intentionally spread assets across multiple wallets to reduce visibility.
Because of this, on-chain data should be used alongside other forms of analysis rather than treated as a guaranteed prediction tool.
Read more: How to Read Crypto Tokenomics: A Beginner’s Guide
FAQs
Q1. Is on-chain data 100% accurate for predicting crypto prices?
No, on-chain data is not a guaranteed price prediction tool. While it provides factual, real-time data from the blockchain ledger, it does not reveal investor intent.
For instance, a massive whale wallet moving funds to an exchange might look like immediate sell pressure, but it could actually be a transfer for futures collateral, internal treasury management, or over-the-counter (OTC) settlements.
On-chain analysis should always be paired with technical and fundamental analysis.
Q2. Is on-chain analysis free, or do I need to pay for tools?
The fundamentals of on-chain analysis are entirely free. Anyone can use public blockchain explorers like Etherscan, Solscan, or Blockchain.com to look up wallet addresses, transaction hashes, and token holder distributions without spending any money. Advanced analytics platforms like Arkham Intelligence and Dune Analytics also offer powerful free tiers.
However, institutional-grade macro data or advanced automated “Smart Money” tracking features (like those on Nansen or Glassnode) typically require a premium subscription.
Q3. What is the difference between on-chain data and off-chain data?
On-chain data refers to any activity recorded and verified directly on the public blockchain architecture (e.g., wallet transfers, gas fees, smart contract execution). Off-chain data refers to activity that happens outside the main blockchain ledger.
This includes traditional order book data on centralized exchanges (like Binance or Coinbase spot order matching), social media sentiment on X, news catalysts, and off-chain scaling layer transactions that haven’t been settled on the main layer yet.
Q4. Can on-chain data show who owns a specific crypto wallet?
Blockchains are pseudonymous, meaning they show public wallet addresses (strings of letters and numbers) rather than real-world names. You cannot directly see the identity of a wallet owner through a basic blockchain explorer.
However, advanced blockchain intelligence tools use data aggregation and machine learning algorithms to link public addresses to known real-world entities, such as specific venture capital funds, institutional exchanges, or public figures.
Conclusion
Learning how to read on-chain data can provide deeper insight into how crypto markets actually operate. Instead of relying only on charts or social media narratives, users can directly analyze wallet activity, exchange flows, network usage, and token movements on the blockchain itself.
For beginners, the best approach is to start simple. Use blockchain explorers, follow large wallet activity, and focus on major assets like Bitcoin or Ethereum before moving into more advanced analytics tools. Over time, recognizing patterns in on-chain activity becomes easier and can help improve both market awareness and crypto research.
Beincom